What goes in our monthly AI brand perception report
The structure of our monthly AI brand perception report for clients: sentiment trend, top claims, theme scores against competitors, actions taken, and what we leave out.
Our monthly AI brand perception report fits on a few pages and follows the same order every month. That's on purpose. A stakeholder who reads it once a month should be able to find the same thing in the same place and see at a glance what changed. If the structure moves around, every report becomes a new document to learn.
This post walks through that structure section by section, explains why each part is there, and lists what we deliberately keep out. It's the perception half of our reporting. Visibility (whether AI names the client at all) has its own report, and we keep the two separate because they answer different questions.
How the report is built
The data side lives in a custom dashboard in Promptwatch, the platform we run client programs on. Saved custom dashboards keep their own date range, models, prompt types, topics, and monitors, and you choose which widgets go on them and in what order. A scheduled PDF report follows its dashboard, with the widgets in the same order, titled with the dashboard's name. Every brand plan includes 10 scheduled PDF reports.
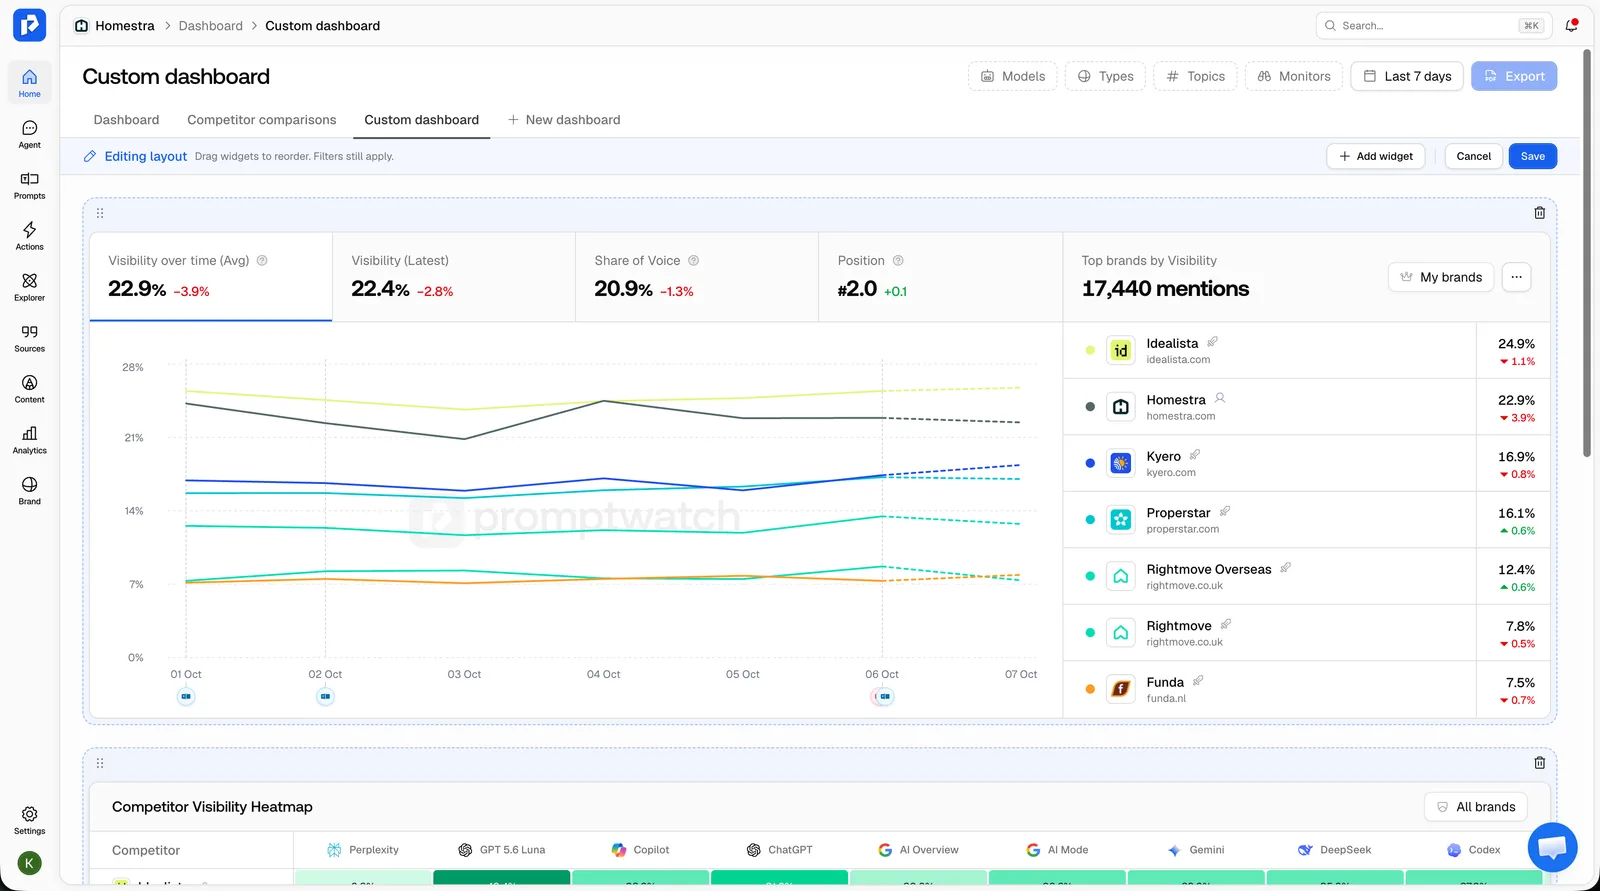 Promptwatch custom dashboards, from the Promptwatch changelog, captured November 6, 2026. Example project data.
We order the dashboard to match the report, so the PDF is the skeleton and the account lead writes the interpretation on top. A chart without interpretation invites the wrong conclusion. The written part is short: a few sentences per section, never a wall of text.
We covered the split between the dashboard a client sees and the one our team works in, in client review dashboard vs team dashboard. The perception report uses the client-facing kind.
Section 1: the summary
Three to five sentences, written last. What moved this month, what we think caused it, and what we want the client to decide or approve. If nothing meaningful moved, we say that in one sentence and don't dress it up. A flat month after a fix is information too.
Section 2: the sentiment trend
The first chart is sentiment over the reporting period, with the comparison to the previous period. Promptwatch scores sentiment on a 100-point scale where around 50 is neutral, higher is more favorable, and lower is more critical.
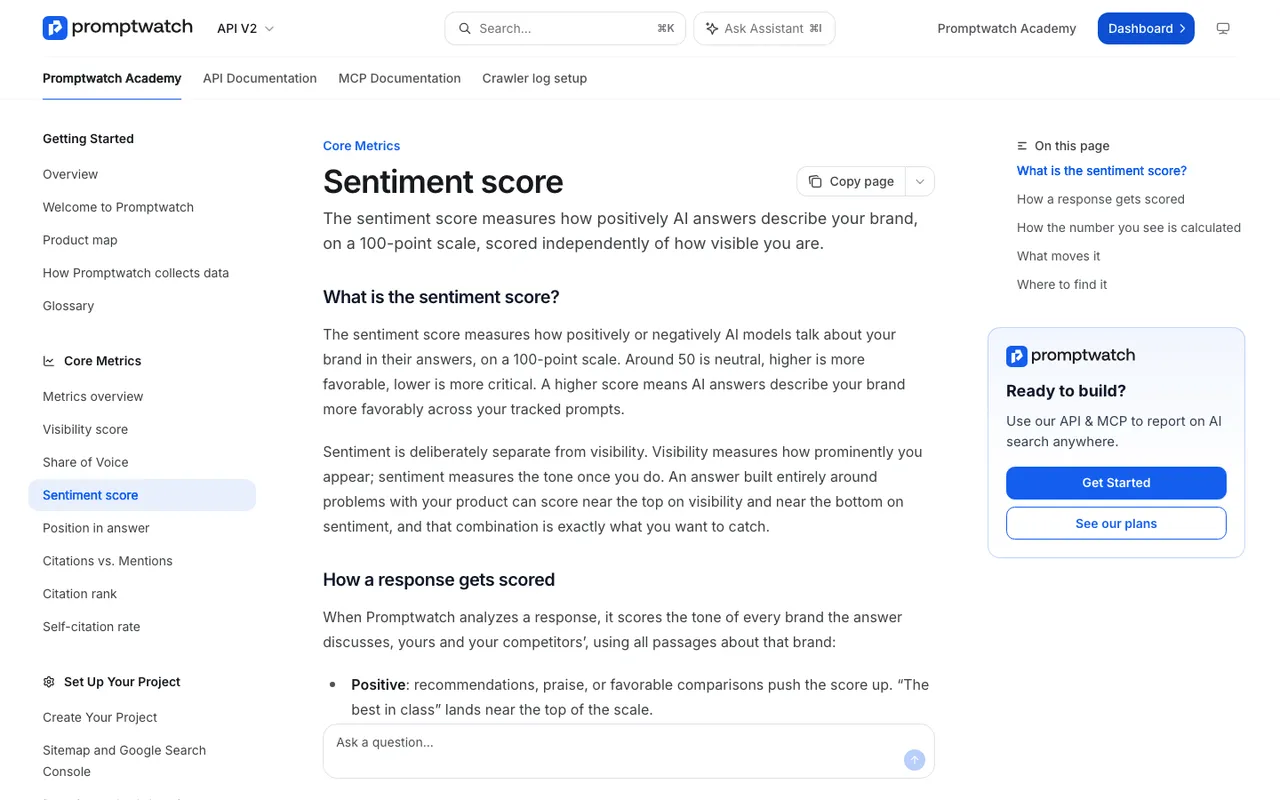 Promptwatch Academy's Sentiment score page, captured November 14, 2026.
Two details from the Academy's Sentiment score page change how we write this section.
The headline Sentiment Score shows the most recent daily average from the last 30 days, so it stays meaningful even when the chosen date range has quiet days. That's not the same thing as the average over the reporting month. We label which figure we're quoting, every time, because a client who compares the headline number to a monthly average will think something broke.
Responses that don't mention the brand aren't counted as zero, and thin mentions (the brand named with no stance) get no score at all. So sentiment describes how the brand is discussed, not whether. We put the response count behind the trend next to the chart. A sentiment move built on few scored responses gets a caveat.
We also show the split by prompt type. Comparison prompts usually score lower than informational ones, so a blended number can dip simply because more comparison answers came in. Showing the split prevents a false alarm.
Section 3: top claims
This is the section clients read most carefully, and the one that makes a perception report different from a dashboard of scores. It comes from Brand Narrative, which pulls the individual claims AI makes about the client and its competitors out of tracked responses, groups repeated claims, files them under themes, and scores each one.
We show three short lists:
- The most repeated negative claims, with how many responses carry each one and which models say it. Repetition matters more than harshness: a claim AI makes daily outweighs a brutal one it made once.
- New claims that appeared this month, positive or negative.
- Claims we were working on that have faded, with the date range we used to check.
Each claim is quoted verbatim, because Brand Narrative keeps the exact sentence. We don't paraphrase what AI said about the client in the report. Paraphrasing is how a report drifts away from the evidence.
One thing clients sometimes expect and won't find here: claims that state a price. Brand Narrative drops claims that state a price, and fragments of shopping product cards, because they change too often to be a useful narrative. When a client has a pricing perception problem, we report the Pricing theme (expensive, good value, free tier) and quote any wrong price figures directly from the responses in a separate note.
Section 4: themes against competitors
Brand Narrative's Benchmark view shows one row per theme the client has claims on, the client's rank among tracked brands on that theme, and the gap to the best competitor. We include this as a table: theme, rank, leader, gap, and the change since last month.
This is where the strategy conversation happens. A theme where the client ranks first is something to protect. A theme where a competitor leads by a wide margin is a candidate for content, PR, or product work. We don't put the radar charts in the report. The radar scale fits the brands displayed, so small differences look big, and the Academy advises reading the tooltip numbers rather than the shape. A table of numbers doesn't have that problem.
Section 5: accuracy, on plans with Fact Check
For clients on Promptwatch's Business plan ($579 a month), Agency Scale, or Enterprise, we add Fact Check's accuracy score: the share of the brand's checked mentions that are accurate, from 0 to 100. The client's mark on a claim wins, inconclusive and unchecked claims don't count, and a wrong claim AI repeats often weighs more than one it said once. Alongside it we include the "Where does AI get it wrong?" view, the same score per model and theme as a heatmap, in a sentence or two rather than as an image, since it's easier to say "Perplexity repeats the old pricing claim" than to make someone read a grid.
For clients on other plans, this section says what we checked by hand and what we found.
Section 6: what we did
A dated list of the changes made since the last report: pages updated, profiles corrected, outreach sent, placements live, Content Refresh drafts approved. We run the work on Promptwatch's Action Board, where accepted tasks move from To Do through In Progress to Done, and the Done column shows the last 14 days of completions. We pull the list from there and add the dates.
This section is what lets next month's report connect cause and effect. Without it, a fading claim is a nice surprise. With it, it's a fix that worked.
Section 7: next month
Three to five actions, each tied to a claim or theme from the sections above, with an owner. If an action needs the client (approve a page, answer a question about their pricing, introduce us to a partner), we say so here.
What we leave out
The report gets better every time we remove something. These are things we've taken out over time:
- Daily sentiment values. A single day with few mentions can swing the average. We show the trend and the period comparison.
- Single harsh responses, unless they're repeated. One answer from one model is a lead for the team, not news for the client.
- Radar charts, for the reason above.
- Raw claim counts without context. "We found 240 claims" says nothing about whether they matter.
- Visibility metrics, which belong in the visibility report. If a perception change is clearly linked to a visibility change, we mention it in one sentence.
- Anything we can't trace back to a quote or a response.
Delivery
The PDF goes out on a schedule, and the account lead forwards it with the written summary on top. Some clients also want a weekly pulse between reports. For those, a Scheduled Chat in Promptwatch (every brand plan includes 10) can deliver a short written briefing in-app or in Slack. We keep that pulse informal and save conclusions for the monthly report, so the client hears one considered view per month instead of four reactive ones.
If you'd like to see how this structure looks on your own brand's data, book a demo with Promptwatch and ask for Brand Narrative's Benchmark view, which is the table clients spend the most time on. More on the platform at promptwatch.com.